Plot the number of reads vs the proportion of '+' stranded reads of all windows from the input data frame.
Arguments
- windows
data frame containing the strand information of the sliding windows. Windows should be obtained using the function
getStrandFromBamFileto ensure the correct data structure.- split
an integer vector that specifies how you want to partition the windows based on coverage. By default
split= c(10,100,1000), partition windows into 4 groups based on these values.- threshold
a
numericvector between 0.5 & 1 that specifies which threshold lines to draw on the plot. The positive windows above the threshold line (or negative windows below the threshold line) will be kept when usingfilterDNA.- save
if TRUE, then the plot will be save into the file given by
fileparameter- file
the file name to save to plot
- groupBy
the column that will be used to split the data (which will be used in the facets method of ggplot2).
- useCoverage
if TRUE then plot the coverage strand information, otherwise plot the number of reads strand information. FALSE by default
- ...
used to pass parameters to facet_wrap during plotting
Details
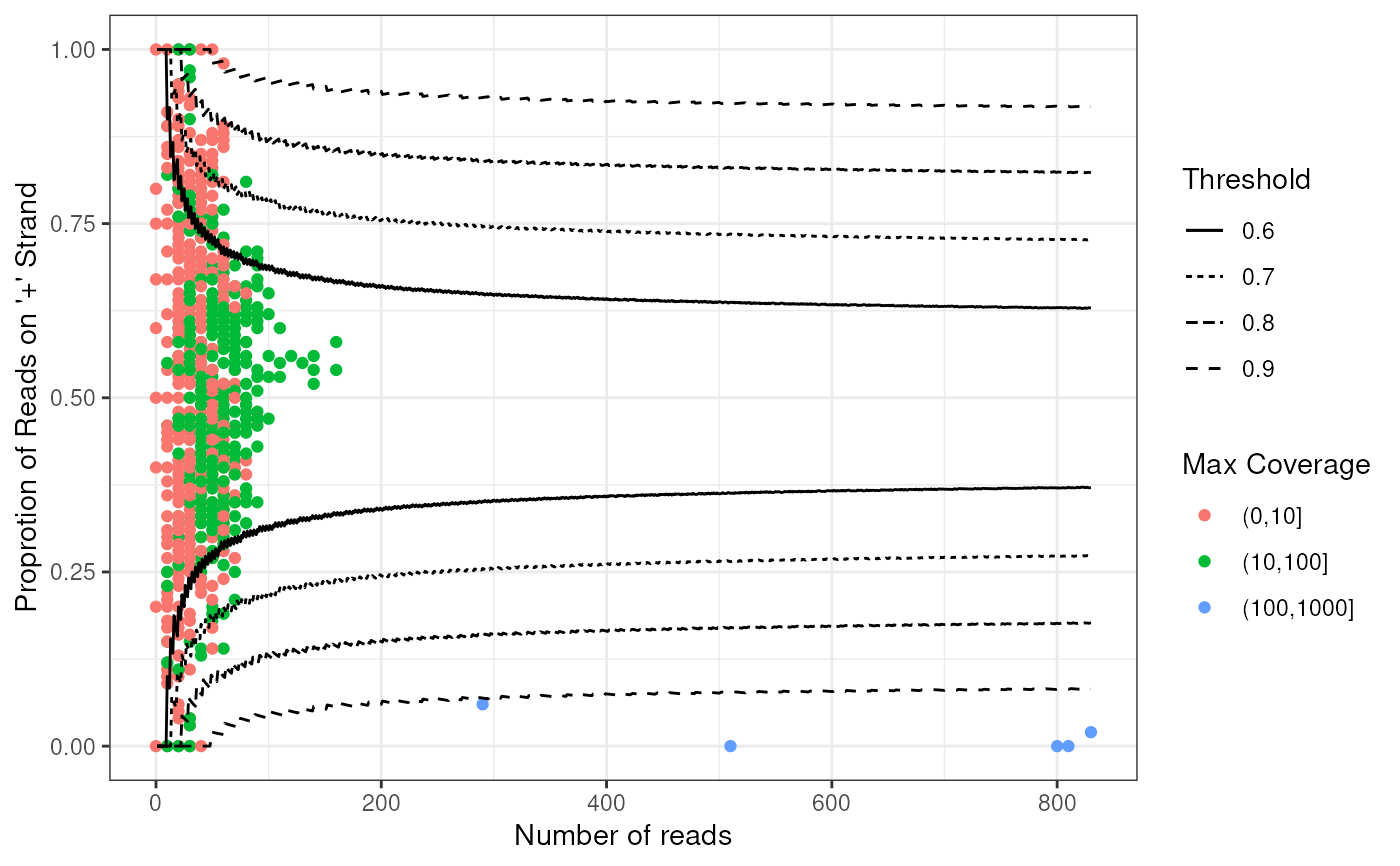
This function will plot the proportion of '+' stranded reads for
each window, against the number of reads in each window.
The threshold lines indicate the hypothetical boundary where windows will
contain reads to kept or discarded using the filtering methods of
filterDNA.
Any plot can be easily modified using standard ggplot2 syntax (see Examples)
Examples
bamfilein = system.file('extdata','s2.sorted.bam',package = 'strandCheckR')
windows <- getStrandFromBamFile(file = bamfilein,sequences = '10')
#> Testing paired end by checking the first 1e+05 reads of file /__w/_temp/Library/strandCheckR/extdata/s2.sorted.bam
#> Your bam file is single end
#> Reading file /__w/_temp/Library/strandCheckR/extdata/s2.sorted.bam
#> Read sequences 10
plotWin(windows)
#> Warning: Removed 1 row containing missing values or values outside the scale range
#> (`geom_point()`).
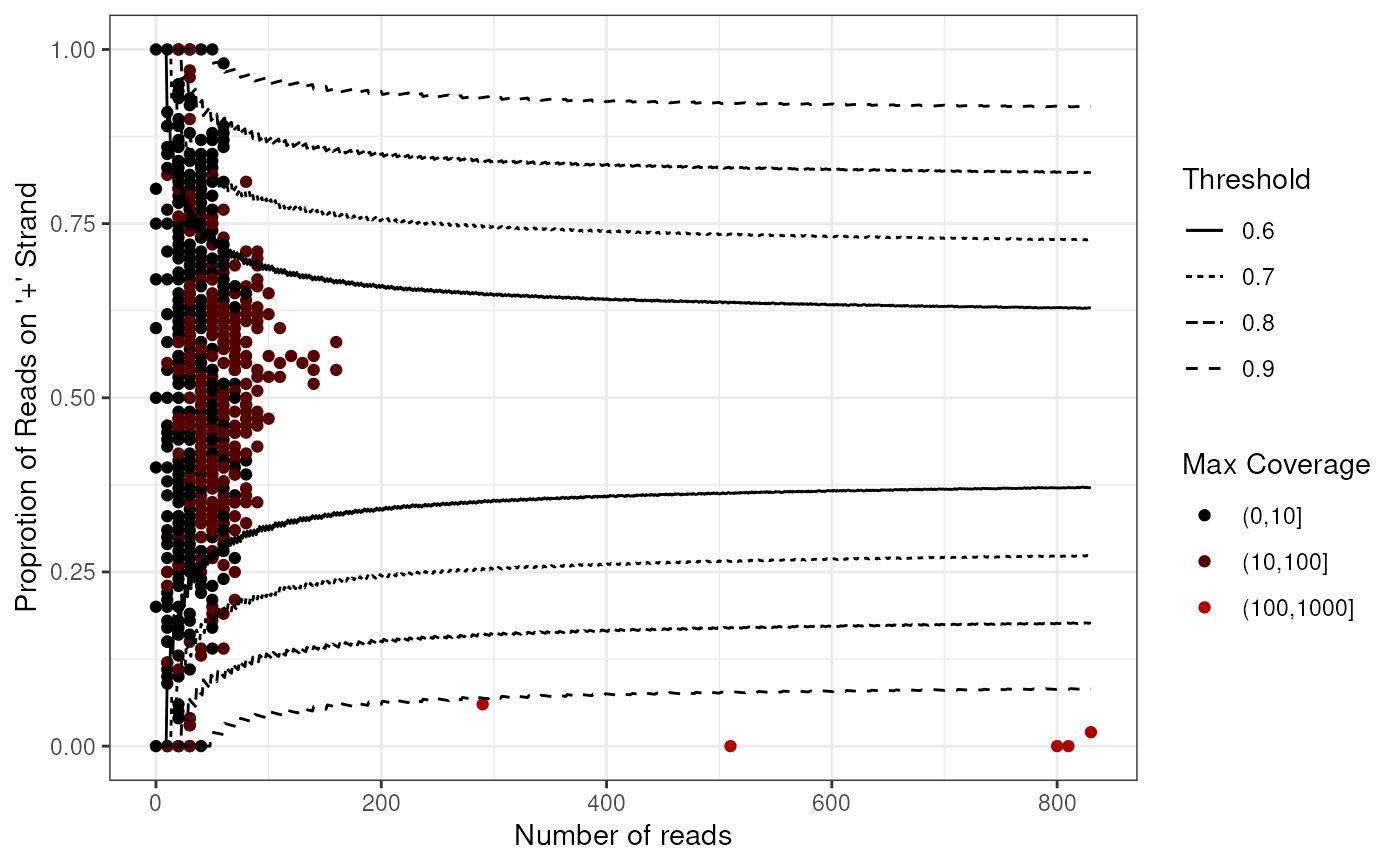
 # Change point colour using ggplot2
library(ggplot2)
plotWin(windows) +
scale_colour_manual(values = rgb(seq(0, 1, length.out = 4), 0, 0))
#> Warning: Removed 1 row containing missing values or values outside the scale range
#> (`geom_point()`).
# Change point colour using ggplot2
library(ggplot2)
plotWin(windows) +
scale_colour_manual(values = rgb(seq(0, 1, length.out = 4), 0, 0))
#> Warning: Removed 1 row containing missing values or values outside the scale range
#> (`geom_point()`).